Black Box Performance Analytics - Defined
A few recent problems came up, where I was asked to help debug why a system was occasionally slow - and I feel it’s worth writing a dedicated article surrounding this topic. To take a small step back, my primary work at this point is that I’m a SQL Server Consultant at Kingfisher Technologies. Very commonly, people will automatically blame the SQL Server database for why something is slow. This is a problem because in systems there are many interlocking components - and claiming something is slow before getting information about it is a problem. But, it’s something I see often.
So when I talk about “Black Box”, in this sense, I’m talking about systems where we largely don’t get to control the inner-workings of the system. This could be an off-the-shelf application that a company bought. This particular post also specifically focuses on looking at this from the SQL Server standpoint. I do have plans of another post that focuses on a more generic network-stack. It’s also worth noting that this isn’t doing performance gathering on SQL Server specifically, but the connection between the “outside world” and SQL Server. While this can be used to help identify areas of focus when performance tuning SQL Server, that’s not the purpose of this specific analysis.
Available Tools
From a SQL Server perspective, there are two main tools for this particular task, each with their pluses and minuses
SQL Server Profiler
SQL Server Profiler has been around for a very, very long time. It’s a graphical utility that comes with SQL Server Management studio [1]. It runs outside of SQL Server, and it can be highly verbose in terms of what’s logged. Some stuff that’s logged can include information such as login/logouts, SQL run on the server, and some general performance analytics such as CPU, Reads, and Writes. It’s also dependent upon the user’s permissions.
Advantages Include:
- Ability to run on the workstation.
- Best for short captures, when looking for very specific types of issues.
- Can be saved to various file formats, fairly easy to digest.
- Supports a multitude of capture filters
Disadvantages Include:
- For multi-user (for analysis), files have to be shared.
- Highly dependent upon user permissions for what’s captured.
- Analysis, within the GUI, is incredibly limiting.
- Because it’s client side, it’s more demanding of the network. Overall performance is less with profiler.
- Events are limited - only 180 events are available.
That said, even given the disadvantages, for very short analysis, SQL Server Profiler is my tool of choice, as long as I can capture what I am interested in. It’ll also be the angle which the Analysis section is based off.
Extended Events
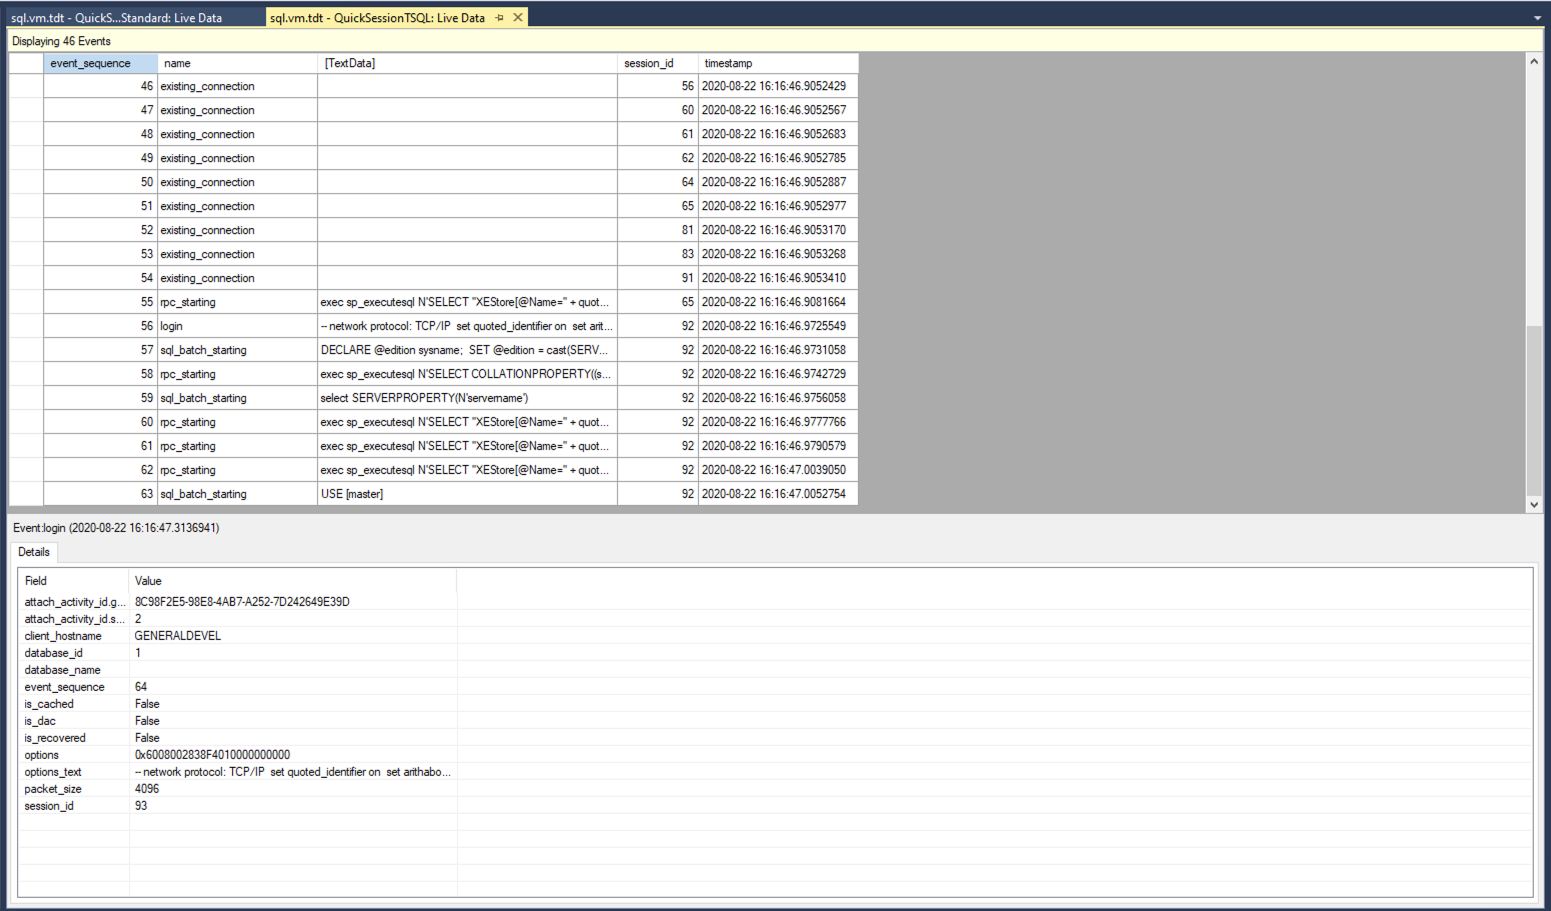
Extended events is a newer technology, and in most ways, vastly superior to SQL Server Profiler [2]. This is especially true in the ability to capture specific types of events, and perform better filtering of those results. For general analysis that can last a longer period of time (hours, to days), Extended Events is the better tool.
Advantages Include:
- It’s run on the server itself, so it just needs to be setup by someone with elevated permissions, and can output to files for anyone to use.
- Very little overhead, compared to Profiler. Extended Events has little impact on the SQL Server itself.
- Can be logged internally (to a degree), or sent to files for further analysis.
- Can be turned on, or off, and the “template” can remain in the system. Very useful for defining a specific capture, saving the template, and running it periodically to gauge better fixes over the long period.
- Supports better automation opportunities (e.g. run only for a period of time)
- Much better performance than profiler, especially if kept in the ring-buffer for specific events of interest.
Disadvantages Include:
- Takes a bit more to set these up, given there are more options available.
- File destinations are a bit more picky, using a network share or the like will be necessary.
Analyzing the Results
This analysis section talks about analysis from a SQL Server Profiler standpoint. Largely because filtering, and analyzing the results is a bit more complicated.
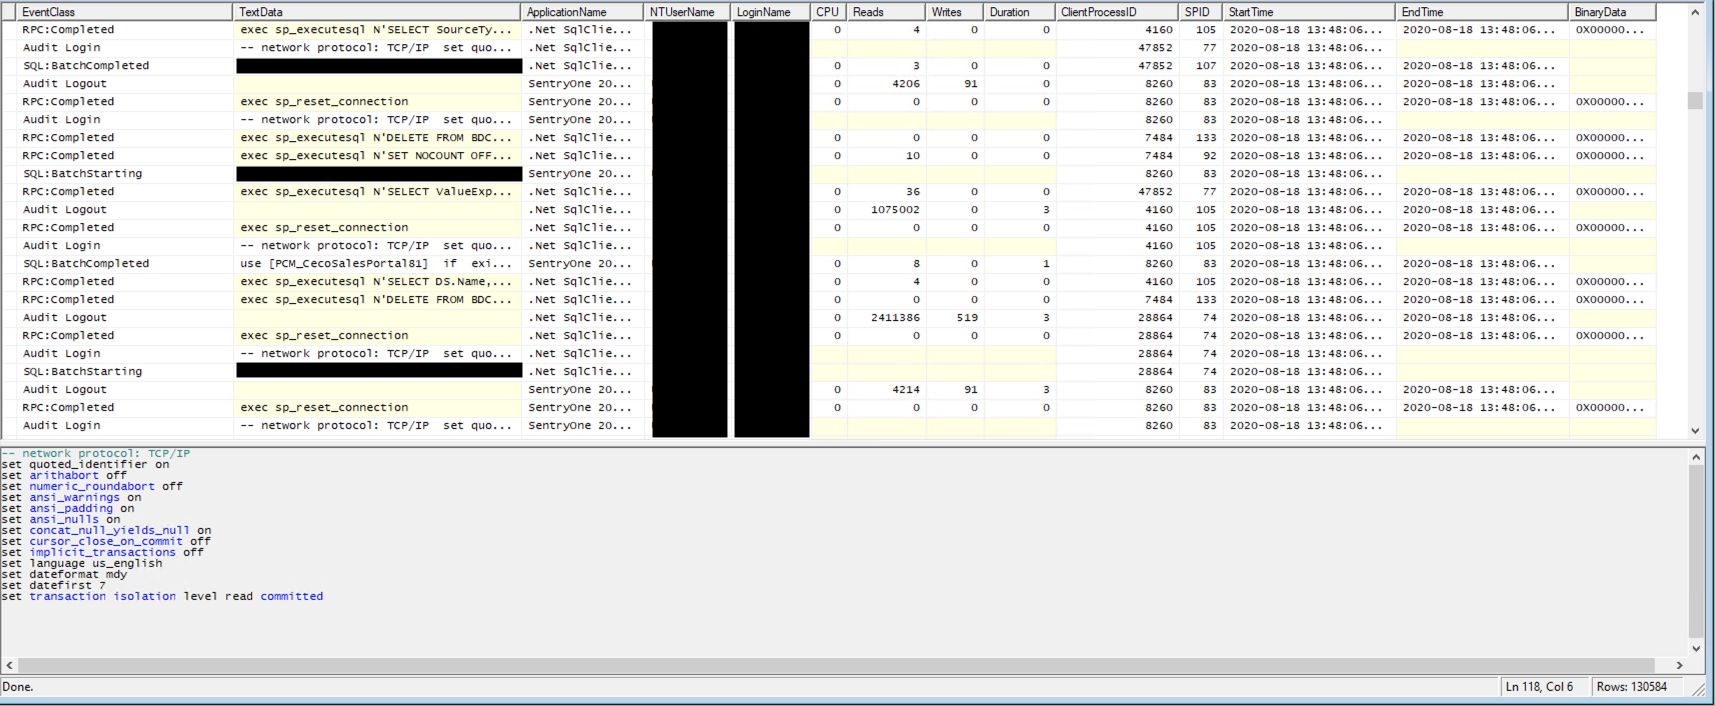
Lets talk about what SQL Server Profiler gives you to start with. After a default trace you have the following columns:
- EventClass - The class of the statement (e.g. login, logout, statement, etc)
- TextData - The SQL of the statement executed
- Application Name - The name of the application connecting (if identified)
- NTUserName - The user executing said request, if a Windows user
- LoginName - The user executing said request, if a direct SQL User
- CPU - CPU time to execute the request (in ms)
- Reads - Number of pages read in the statement
- Writes - Number of pages written in the statement
- Duration - The length of time the statement took, in ms
- ClientProcessID - The server process id that’s dealing with the request
- SPID - The client process id that’s executing the request
- StartTime - The time the process/statement started (with ms)
- EndTime - The time which the process/statement ended (with ms)
This can be exported as XML. One important note about the XML is that the duration is in Microseconds when exported, but in Milliseconds when viewed through the GUI.
To fully analyze the results, it’s better to use a script and/or 3rd party application to analyze the results. I decided to do my project in Linqpad, an application that allows for quick prototyping and work. You can download the script [3]. The only Nuget library that’s required for this script is CsvHelper. This file takes an XML export from SQL Server Profiler, and outputs a CSV based off search. In my particular case, since most web applications have a primary key based off a unique id, we can use that to help filter the results. To explain how this works:
First, lets define a class to hold the data. You’ll likely notice how there are [ignore] decorators. These are ignored via the CSV export, and instead, I split the data up so I can filter and compute off it later. This is why we have getters in various areas.
1
2
3
4
5
6
7
8
9
10
11
12
13
14
15
16
17
18
19
20
21
22
23
24
25
26
27
28
29
30
internal sealed class TraceData
{
	public string LoginName { get; set; }
	public string ApplicationName { get; set; }
	[Ignore]
	public DateTime StartTimeO { get; set; }
	public string StartDate { get => StartTimeO.ToString("MM/dd/yyyy"); }
	public string StartTime { get => StartTimeO.ToString("H:mm:ss:fff"); }
	[Ignore]
	public DateTime EndTimeO { get; set; }
	public string EndDate { get => EndTimeO.ToString("MM/dd/yyyy"); }
	public string EndTime { get => EndTimeO.ToString("H:mm:ss:fff"); }
	public long DurationMicro { get; set; }
	public long DurationMs { get => DurationMicro / 1024; }
	[Ignore]
	public TimeSpan DeltaFromPreviousO { get; set; }
	public int DeltaFromPreviousMs
	{
		get {
		  return (int) Math.Round(DeltaFromPreviousO.TotalMilliseconds);
		}
	}
	[Ignore]
	public string Sql {get;set;}
	public string SqlShort {get => Sql?.Substring(0,50); }
	public int ClientProcessId {get;set;}
	public int Spid {get; set; }
	public int Reads {get;set;}
	public int Writes {get;set;}
	public int Cpu {get;set;}
Next, we need to parse the XML file. I used LinqToXML to process the results. Because of the way this is formatted, I had to go through some extra hoops to make this work. I am only containing a portion of the the main logic:
1
2
3
4
5
6
7
8
9
10
11
12
13
14
15
16
17
18
19
20
21
22
23
24
25
26
27
28
29
30
31
32
33
34
35
36
37
List<TraceData> traceData = new List<TraceData>();
TraceData lastTrace = null;

foreach(XElement element in loadedXML.Elements().Where(x => x.Name.LocalName == "Events").Descendants().Where(xx => xx.Elements().Any()
          && xx.Attribute("name")?.Value == "RPC:Completed").Where(xxx => xxx.Elements().Any(xxxx => xxxx.Attribute("name").Value == "TextData")))
{
	var elements = element.Elements();

	TraceData dataToAdd = new TraceData() {
		LoginName = elements.FirstOrDefault(x => x.Attribute("name")?.Value == "NTUserName" || x.Attribute("name")?.Value == "LoginName")?.Value,
		Sql = elements.FirstOrDefault(x => x.Attribute("name")?.Value == "TextData").Value,
		ApplicationName = elements.FirstOrDefault(x => x.Attribute("name")?.Value == "ApplicationName").Value,
	};

	if(!string.IsNullOrEmpty(sqlSearch)) {
		if(!dataToAdd.Sql.Contains(sqlSearch))
		{
			continue;
		}
	}

    // ...

    DateTime endTime;
	if (DateTime.TryParse(elements.FirstOrDefault(x => x.Attribute("name")?.Value == "EndTime")?.Value, out endTime))
	{
		dataToAdd.EndTimeO = endTime;
	} else {
		dataToAdd.EndTimeO = dataToAdd.StartTimeO;
	}

    if(lastTrace != null) {
		dataToAdd.DeltaFromPreviousO = dataToAdd.StartTimeO - lastTrace.EndTimeO;
	}
	lastTrace = dataToAdd;
	traceData.Add(dataToAdd);
}
To explain this. First, we are searching under the “Events”, that have a login of some time, are of type “RPC:Completed” (meaning, SQL was executed), with TextData. This filters everything but SQL calls itself. The first if statement is a variable I defined far further up in the program which allows us to search for a specific string in the SQL statement text. Since this is a web application I’m dealing with, I’m interested in statements containing the primary key. In many cases, this gets most of the calls a web application will do. Not necessarily all, but it’ll end up being most.
The other if statements, including the block I commented out, deal with pulling in and converting the types. Since I’m ignoring the raw DateTime information out of this, but still need them for stuff like the deltas I calculate. The reason for the DeltaFromPreviousO is that I’m aiming to determine the time that’s spent inside the application, and the time spent in SQL.
In the end, export the data. Which is fairly simple to do:
1
2
3
4
5
6
7
8
9
10
11
string report = $"{Path.GetDirectoryName(fileName)}\\{Path.GetFileNameWithoutExtension(fileName)}.csv";

Console.WriteLine($"Writing report to... {report}");

using (var csvWriter = new StreamWriter(report))
{
	using (var writer = new CsvWriter(csvWriter, CultureInfo.InvariantCulture))
	{
		writer.WriteRecords(traceData);
	}
}
In the end, we get an excel file that has something like the following:
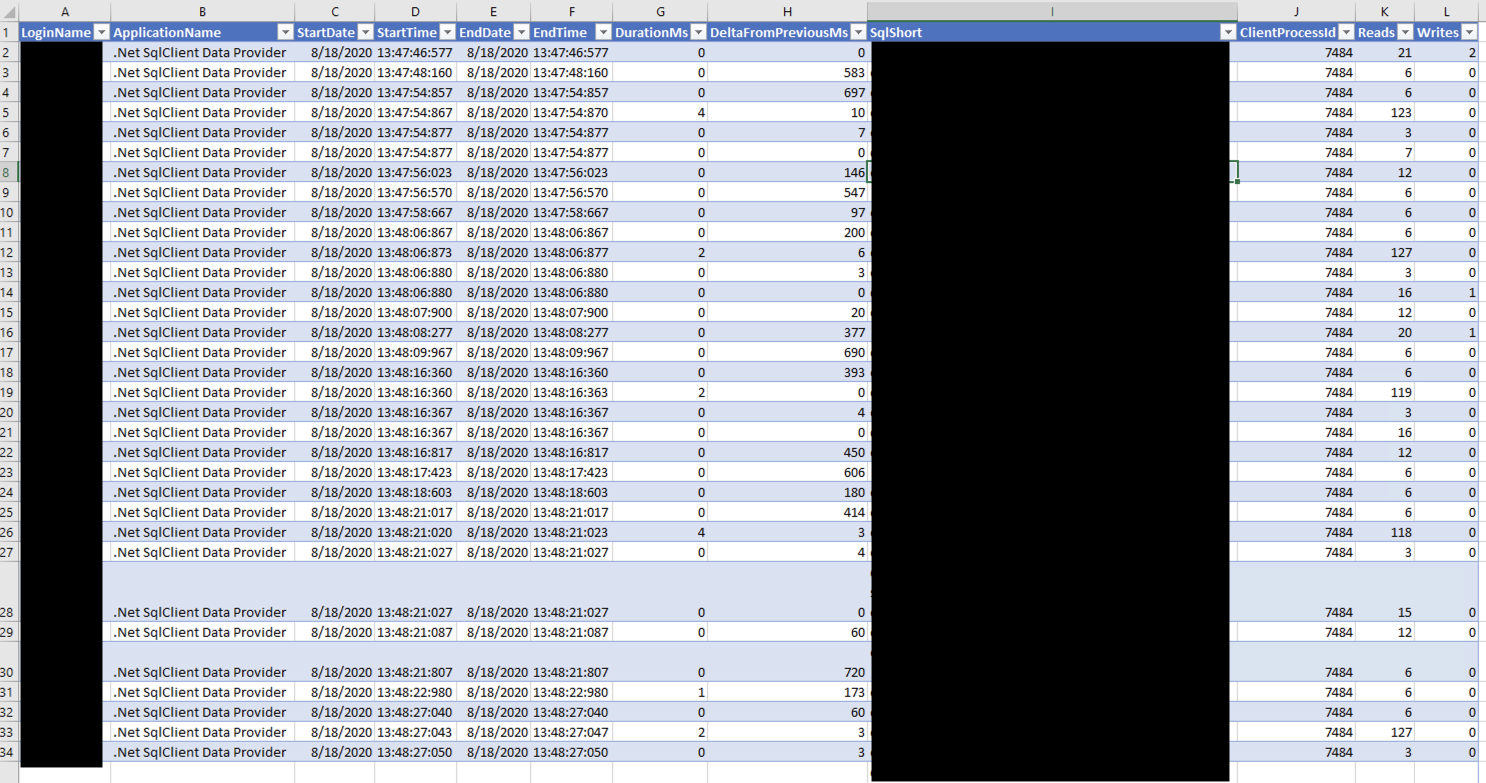
This excel file gives us a lot of good information. While it’s not 100% accurate for all calls to a database, from the app, it does paint a fairly good picture. To describe the most relevant columns:
- StartTime - The time the call made
- EndTime - The time the call finished
- DurationMs - The duration of the call in Milliseconds (note, the XML does microseconds)
- DeltaFromPreviousMs - The time it took for the application to make another call (in milliseconds)
Conclusions
Analyzing results from SQL Server Profiler can be quite powerful, but to make the most out of it, some programming is required. When analyzing specific queries, one can get away with looking at the metrics presented in the trace file specifically - but, for trending and the like, post processing is still useful. Because everything’s in XML, parsing can be difficult at first glance but overall it’s not too bad.
The script and code provided is licensed under creative commons. Please feel free to use it however you wish.
References
- 1: https://docs.microsoft.com/en-us/sql/tools/sql-server-profiler/sql-server-profiler?view=sql-server-ver15
- 2: https://docs.microsoft.com/en-us/sql/relational-databases/extended-events/extended-events?view=sql-server-ver15
- 3: https://github.com/TheDarkTrumpet/thedarktrumpet.github.io.supplementals/blob/master/posts/2020-8-23/ParseXMLTrace.linq